
Uptime Kuma is a self-hosted monitoring tool that allows you to keep track of your websites, services, and applications. Here is a list of different Monitoring types supported by Uptime Kuma:
## General Monitor Type
- Group
- HTTP(s)
- TCP Port
- Ping
- HTTP(s) - Keyword
- HTTP(s) - JSON Query
- gRPC(s) - Keyword
- DNS
- Docker Container
- HTTP(s) - Browser Engine (Chrome/Chromium) (Beta)

## Passive Monitor Type
- Push

## Specific Monitor Type
- Steam Game Server
- GameDig
- MQTT
- Kafka Producer
- Microsoft SQL Server (SQLServer)
- PostgreSQL (Postgres)
- MySQL/MariaDB (MySQL)
- MongoDB
- Radius
- Redis
Step 1: Create a Directory for Uptime Kuma
To keep your data persistent and organized, create a directory for Uptime Kuma’s data:
mkdir -p ~/uptime-kuma/data
Navigate to this directory:
cd ~/uptime-kuma
Step 2: Create a Docker Compose File
Docker Compose simplifies managing multi-container Docker applications. Create a docker-compose.yml file in the uptime-kuma directory with the following content:
services:
  uptime-kuma:
    image: louislam/uptime-kuma:1
    container_name: uptime-kuma
    volumes:
      - ./data:/app/data
      - /var/run/docker.sock:/var/run/docker.sock
    ports:
      - 3001:3001
    restart: unless-stopped
    security_opt:
      - no-new-privileges:true
    networks:
      - yournetwork
networks:
  yournetwork:
    external: true
This configuration:
- Uses the
louislam/uptime-kuma:1image. - Mounts a local
datadirectory to persist Uptime Kuma’s data. - Binds the Docker socket (
/var/run/docker.sock) to monitor Docker containers. - Maps port
3001on your host to port3001in the container. - Ensures the container restarts unless explicitly stopped.
- Uses a custom network named
yournetwork(you may need to create this network if it doesn’t exist).
Step 3: Create the Docker Network (If Needed)
If the network doesn’t exist, create it:
docker network create yournetwork
Step 4: Start Uptime Kuma
Run the following command in the directory containing your docker-compose.yml file to start Uptime Kuma:
docker compose up -d
The -d flag runs the container in detached mode (in the background). Docker will pull the Uptime Kuma image if it’s not already present and start the container.
Step 5: Access Uptime Kuma
Once the container is running, open your web browser and navigate to http://localhost:3001 (or replace localhost with your server’s IP address if you’re running it on a remote machine). You’ll see the Uptime Kuma login screen.
- The default username is
admin. - The default password is
admin. It’s recommended to change this immediately after logging in for security.
Step 6: Configure Uptime Kuma
After logging in, you can start configuring Uptime Kuma to monitor your services and set up notifications. Here’s how to monitor Docker containers or webpages and configure Telegram notifications:
Monitoring Docker Containers
Uptime Kuma can monitor Docker containers directly if you’ve mounted the Docker socket (/var/run/docker.sock) in your docker-compose.yml file, as shown above. Follow these steps:
- In the Uptime Kuma web interface, click on “+ Add New Monitor” in the top-right corner.
- Select “Docker Container” as the monitor type.
- Enter the following details:
- Friendly Name: A descriptive name for the container (e.g., “Paperless-ng”).
- Container Name/ID: The name or ID of the Docker container you want to monitor (e.g., “paperless-ng”).
- Docker Host: The Docker host where the container is running (e.g., “docker” if running locally).
- Heartbeat Interval: How often Uptime Kuma checks the container’s status (default is 60 seconds).
- Retries: The number of failed checks before marking the container as down (default is 1).
- Heartbeat Retry Interval: How often Uptime Kuma retries if a check fails (default is 60 seconds).
- Optionally, add tags or enable “Upside Down Mode” if needed (e.g., to flip the status logic).
- Click “Save” to create the monitor.
Uptime Kuma will now monitor the specified Docker container’s status, showing a green status bar (100%) if the container is running or a red status bar (0%) if it’s down.
Monitoring Webpages
To monitor websites or webpages:
- Click on “+ Add New Monitor” in the Uptime Kuma web interface.
- Select “HTTP(s)” as the monitor type.
- Enter the following details:
- Friendly Name: A name for the website (e.g., “Home Page”).
- URL: The URL of the webpage or website you want to monitor (e.g., “https://example.com”).
- Method: Choose “GET” (default) or another HTTP method if needed.
- Expected Status Code: The HTTP status code you expect (default is 200 for a successful response).
- Heartbeat Interval: How often Uptime Kuma checks the webpage (default is 60 seconds).
- Retries and Heartbeat Retry Interval: Configure as needed for reliability.
- Optionally, add authentication, headers, or keywords to verify the webpage content.
- Click “Save” to create the monitor.
Uptime Kuma will periodically check the webpage and notify you if it becomes unreachable or returns an unexpected status.
Apply Notifications to Monitors
There are many different notification types. For this guide we will use Telegram:
- Edit any monitor (e.g., a Docker container or webpage) by clicking the pencil icon next to it.
- Under the “Notifications” section, click “Setup Notification” and select your Telegram notification.
- Save the changes.
Setting Up Telegram Notifications
Uptime Kuma supports Telegram notifications to alert you when a monitor goes down or recovers. Here’s how to configure it:
Create a Telegram Bot
- Open Telegram and search for “BotFather.”
- Send
/startto BotFather, then use the/newbotcommand to create a new bot. - Follow the prompts to name your bot and get a bot token (e.g.,
123456:ABC-DEF1234ghIkl-zyx57W2v1u123ev11).
Get Your Chat ID
- Send a message to your bot in Telegram.
- Use a tool or service (e.g.,
@userinfobotin Telegram) to find your chat ID, or use an API call with your bot token to retrieve it. For example, visithttps://api.telegram.org/bot<YourBotToken>/getUpdatesin a browser to see recent messages and extract your chat ID (e.g.,-123456789for a group or a numeric ID for a private chat).
Configure Telegram in Uptime Kuma
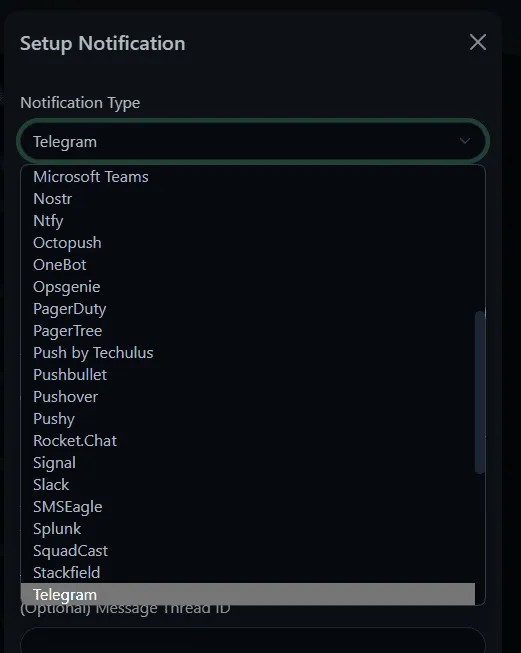
- In the Uptime Kuma web interface, go to “Settings” > “Notification” > “Add New Notification.”
- Select “Telegram” from the list of notification types.
- Enter the following details:
- Bot Token: The token you received from BotFather (e.g.,
123456:ABC-DEF1234ghIkl-zyx57W2v1u123ev11). - Chat ID: Your Telegram chat ID (e.g.,
-123456789for a group or your personal numeric ID).
- Bot Token: The token you received from BotFather (e.g.,
- Click “Test” to verify the configuration, then save it.
Now, Uptime Kuma will send Telegram messages whenever a monitored service goes down or recovers, keeping you informed in real-time.
Step 7: Secure Your Setup
- Change the default
adminpassword in the Uptime Kuma settings. - Consider using HTTPS by setting up a reverse proxy (e.g., Nginx or Traefik) with SSL/TLS certificates from Let’s Encrypt if Uptime Kuma is exposed to the internet.
- Regularly back up the
datadirectory to prevent data loss.
Conclusion
Setting up Uptime Kuma with Docker is a quick and effective way to monitor your services, whether they’re Docker containers, webpages, or other applications. Happy monitoring!